How to estimate the weight of visual input in the control of orthostatic posture?
Osamu SASAKI*, Maurice OUAKNINE** , Vladimir USATCHEV***, Pierre-Marie GAGEY****
**Sakura clinic of Soujinkai, Tokyo
** ORL service, Timone, Marseille
*** Medical academy of Post-graduate Education, Saint-Petersburg
****Institute of Posturologie, Paris
K.W.: Signal Analysis, Visual input, Romberg's Quotient, Subjective Vertical Line
Introduction
Hundred years after the Romberg's first publication (1840), doctors were not yet convinced that the visual information participates normally in the control of orthostatic posture; the communication of Lee during the meeting of the International Society of Posturography, Paris 1975, made sensation (Lee & Lishmann, 1976). A video presented a toddler, 18 months old, standing in a room the ground of which was perfectly stable but its walls were mobile; at every movement of these walls, the child fell, pulled in the direction of the walls movement.
This historical event allows to underline that stabilometry has been a precious instrument to confirm that vision is a normal input of the postural system (Henriksson et al., 1967) and to estimate the weight of the visual information in the control of orthostatic posture by the famous Romberg’s quotient (Van Parys et al., 1976).
The parameter of statokinesigram area has been massively used to calculate this Romberg’s Quotient, it appears now that it is not the good choice...
Indeed, the area is a parameter which qualifies a result: the precision of the postural control which can be more or less good. But one can obtain the same result by various means. Eyes closed, the precision of the postural control can be as good as eyes open, but, possibly, something in the tactics, the dynamics, changed because of the absence of visual information.
It is thanks to a stabilometric signal analysis finer than the conventional analyses (Statistics, FFT, Wavelets, etc.) that one could realize this error (Sasaki et al., 2002). This fine analysis considers the signal as from a non-linear dynamic system. This work, first presented at the meeting of the «Association Posture et Équilibre» in Brussels 2002, will be called back only briefly.
Material and Methods
23 normal subjects were recorded on an ‘AFP-40/16’ stabilometric platform (Gagey et al., 2001), during three series of randomised experiments which compared:
- Two identical situations, eyes open,
- A situation eyes open to a situation eyes closed,
- Two eyes open situations with and without optokinetic stimulation. During the stimulation a pattern made of black aleatory dots on a white background moved from left to right , at 60 °/s.
The conventionnal stabilometric parameters of these recordings were calculated as well as the variations of the dynamics of the postural system, by means of the ‘indice de similitude’ of Le Van Quyen (2000). This ‘indice de similitude’ allows to compare the rhythm of the dance of the centre of pressure, called thereafter Sasaki's rhythm, between two different recordings.
Results
Only an important retinal slip, entailing a vection, modifies in a significant way the ‘indice de similitude’ (tab. I).
|
Indice LVQ/X
|
Indice LVQ/Y
|
|
|
YO/YO
|
0,859±0,121
|
0,926±0,123
|
|
YO/YF
|
0,929±0,1
|
0,892±0,101
|
|
YO±SO
|
0,755±0,272
|
0,804±0,197*
|
TAB I - Mean and S-D of the ‘indice de similitude’ of Le Van Quyen for the left/right sway ( LVQ/X ) and the forward/backward sway (LVQ/Y) in the three series of comparisons: eyes open/eyes open (EO/EO), eyes open and closed (EO/EC ). Eyes open with and without optokinetic stimulation (EO±OS ). (*: p < 0,05).
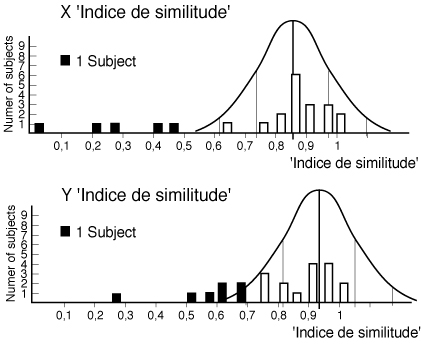
But looking more precisely at the distributions of the ‘indice de similitude’ of Le Van Quyen shows that, even under optokinetic stimulation, only the ‘indice de similitude’ of some subjects (black subjects) are outside the limits of random variations, the ‘indice de similitude’ of the other subjects (white subjects) fluctuates inside the limits of random variations (fig. 1).
FIG. 1 - Histograms of the distributions of the ‘indice de similitude’ of Le Van Quyen comparing the situations eyes open with and without optokinetic stimulation, for the right-left sway (X ‘indice de similitude’) and the forward-backward sway (Y ‘indice de similitude’).
The Gaussian curves represent the theoretical distribution of the random variations of the ‘indice de similitude’.
The black subjects react in a significant way to the optokinetic stimulation while the white subjects do not react in a significant way to the optokinetic stimulation.
Now, when the Romberg’s quotient of these white or black subjects is calculated, one notices that the subjects who do modify their Sasaki's rhythm in a significant way under optokinetic stimulation (black subjects) behave as "blind subjects" for area and conversely subjects who do not modify their Sasaki's rhythm under optokinetic stimulation (white subjects), modify their Statokinesigram area when they close their eyes (fig. 2).
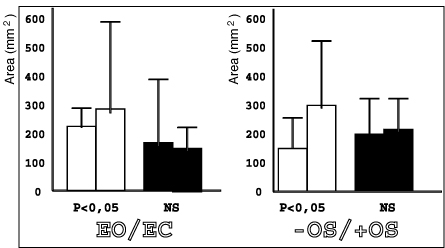
FIG.2 - Mean and S-D of the statokinesigram area from different experimental series and different populations.
Left part of the figure: EO/EC. Mean and S-D of the statokinesigram area of the series of recordings comparing the situation eyes open (left columns of each population) with the situation eyes closed (right columns of each population) in the population which does not modify its Sasaki's rhythm under optokinetic stimulation (white columns) and the population which does modify its Sasaki's rhythm under optokinetic stimulation (black columns).
Right part of the figure: -OS/+OS. Mean and S-D of the statokinesigram area of the series of recordings comparing the situation without optokinetic stimulation (left columns of each population) and the situation under optokinetic stimulation (right columns of each population) in the population which does not modify its Sasaki's rhythm under optokinetic stimulation (white columns) and the population which does modify its Sasaki's rhythm under optokinetic stimulation (black columns).
Whatever be the variation of the visual information (eyes open/eyes closed; with or without optokinetic stimulation), the difference between areas is not significant for the subjects who do modify their Sasaki's rhythm under optokinetic stimulation. So they do not modify the precision of their postural control (its result), but they do modify the dynamics of its control (its tactics).
This interpretation is confirmed by looking at the statokinesigram length from these various recordings (fig. 3).
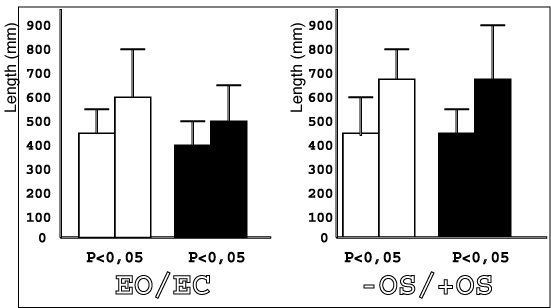
FIG.3 – Mean and S-D of the statokinesigram length according to the experimental series and populations.
Left side of the figure: EO/EC. Mean and S-D of the statokinesigram length of the series of the recordings comparing the situation eyes open (left columns of each population) and the situation eyes closed (right columns of each population) in the population which does not modify its Sasaki's rhythm under optokinetic stimulation (white columns) and the population which does modify its Sasaki's rhythm under optokinetic stimulation (black columns).
Right side of the figure: -OS/+OS. Mean and S-D of the statokinesigram length of the series of the recordings comparing the situation without optokinetic stimulation (left columns of each population) and the situation under optokinetic stimulation (right) columns of each population) in the population which does not modify its Sasaki's rhythm under optokinetic stimulation, (white columns) and the population which does modify its Sasaki's rhythm under optokinetic stimulation (black columns).
Under optokinetic stimulation, the subjects which do modify their Sasaki's rhythm modify also their statokinesigram length while they do not modify their statokinesigram area. Let us remind that length is an image of the energy spent by the postural system to reach its objective of stabilization (Vallier, 1994).
Discussion
The parameter of statokinesigram area, whatever be its technique of calculation - area of the confidence ellipse (Takagi et al., 1985), RMS (Paulus et al., 1984) or any other (Imaoka et al., 1997) -, estimates the precision of the stabilization of the subject by his postural system.
The parameter of statokinesigram length, whatever be the sampling frequency of the signal - provided that it remains coherent with the metrological characteristics of the platform -, estimates the importance of the movements of the centre of pressure used by the system to stabilize the subject.
Each of these old conventional parameters estimates different aspects from the functioning of the postural system, and the not linear dynamic analysis of the stabilometric signal underlines the interest of these two operators who should be used both in our logical approach of the functioning of the postural system of our patients. It is necessary to privilege neither the analysis of the result, nor the analysis of the means utilised to get the result. The famous Romberg’s quotient should be calculated by means of these two parameters to be sure to estimate correctly the weight of the visual information in the postural control.
As there are two parameters derived from measurement of length, the speed of the movements of the centre of pressure and its variance, one can wonder if Romberg's quotient should not be calculated also or preferentially from these parameters derived from measurement of length. The answer is obviously negative for the speed of movement of the centre of pressure, which is nothing else than the length divided by a constant, the recording duration. The answer on the other hand is not evident for the variance of the speed, we have got no firm data to answer the question. One can only note that Ouaknine and Grini (2000), Usatchev and Mokhov (2004), Gagey and Gentaz (1993) consider and show that the variance of the speed is a logical operator who introduces to an understanding of the postural control mechanisms, which escapes the parameter of length. One can add, as a free hypothesis, that it is likely that the variance of the speed is correlated to the rythm of the dance of the centre of pressure.
But that remains to be criticized. The same holds true for this idea, attractive but still not based, that one can appreciate the weight of the visual input of the control of orthostatic posture by studying the subjective vertical line. It is not enough that exists between both phenomena a correlation, even strong, to be able to assert that exists among them a link of causal type.
References
Gagey P.M., Gentaz R. (1993) Le paramètre “VFY” en stabilométrie. Agressologie, 34, 4: 183-185.
Gagey P.M., Ouaknine M., Sasaki O. (2001) Pour manifester la dynamique de la stabilisation: la plate-forme AFP40/16. In M. Lacour (Ed.) Posture et équilibre. Nouveautés 2001, conceptuelles, instrumentales et cliniques. Solal, Marseille, 95-106.
Grini M.N., Ouaknine M., Giovanni A. (2000) Modifications posturales et segmentaires contemporaines du forçage vocal. Rev. Laryngol Otol Rhinol 121 : 319-323
Henriksson N.G., Johansson G., Olsson L.G., Ostlund H. (1967) Electric analysis of the Romberg test. Acta Otolaryngol. Suppl. (Stockh.) 224: 272-279.
Imaoka K., Murase H., Fukuhara M. (1997) Collection of data for healthy subjects in stabilometry. Equilibrium Research, Supp. 12: 1-84.
Lee D.N., Lishmann J.R. (1976) Vision - The most efficient source of propriocetive information for balance control. Agressologie, 18, A: 83-94
Le Van Quyen M, Adam C, Martinerie J (2000) Spatio-temporal characterizations of non-linear changes in intracranial activities prior to human temporal lobe seizures. Eur J Neurosci, 12: 2124-2134
Paulus W. M., Straube A., Brandt Th. (1984) Visual stabilization of posture: physiological stimulus characteristics and clinical aspects. Brain, 107: 1143-1164.
Romberg M.H. (1840) Lehrbuch der Nervenkrankheiten des Menschen. Berlin, Duncker
Sasaki O., Usami S-I, Gagey P.M., Martinerie J., Le Van Quyen M., Arranz P. (2002) Role of visual input in nonlinear postural control system. Ex. Brain Res., 147:1–7
Takagi A., Fujimura E., Suehiro S. (1985) A new method of statokinesigram area measurement. Application of a statistically calculated ellipse. In Igarashi M., Black F.O. (Eds) Vestibular and visual control of posture and locomotor equilibrium. Karger (Basel): 74-79.
Usatchev V., Mokhov (2004) Apports de l’analyse vectorielle dans le diagnostic des dysfonctions posturales. [Traduction française: http://perso.club-internet.fr/pmgagey/AnalyseVectorielleUsatchev.pdf]
Vallier G. (1994) Analyse statistique multivariée concernant 60 patients présentant un syndrome de déficience posturale. Thèse Médecine, Paris
Van Parys J.A.P., Njiokiktjien Ch. (1976) Romberg's sign expressed in a quotient. Agressologie, 17, B: 95-100.