Vierordt was right
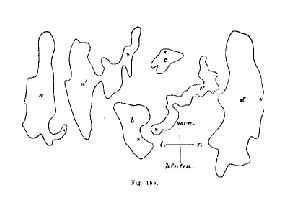
As early as in the middle of the XIXth century, Vierordt had understood that the human body is never in equilibrium, but keeps trying to find that ephemeral instant during which all the forces acting on his body mass cancel each other (Vierordt, 1860). And Vierordt tried to understand those fluctuating dynamics by recording postural sway, sure as he was that such small scribble was full of information (fig. 1).
 |
|
Indeed, for about thirty years, the analysis of the stabilometric signal shows that Vierordt was right. The more we develop our conventional, frequential or stochastic analyses, the more we realise that Vierordt's faith was well-founded.
So why not accept the nonlinear dynamic analysis? Indeed, it has already given some exceptionally strong proofs (Gagey et al., 1998; Sasaki et al., to be published). But it is not obvious to understand, one has to be prepared.
Understanding Takens
At first sight, the stabilometric signal is no more than a group of points, the coordinates of which have been recorded in a biomechanical referential.
But those points are arranged in time, and the logic of stabilisation allows us to understand intuitively that the position of a point at instant t depends on the position of the point at instant t-1: the body goes backwards because it had gone forward too much, etc..
In other words, that temporal series is recursive - what happens at instant t is function of what happened at instant t-1:
Those points tell us a story, as we could say in a more vivid way: they bear the fruits of a movement, of some dynamics...
Now, those points are the points of application of the resultant of the forces that the platform opposes the forces applied on it by the subject's body. The story tells us that the stabilometric signal is therefore a story of forces, i.e. of masses, accelerations, speeds, a story of dynamics - the dynamics of the dynamics, as we could say to play on the two meanings of the word.
And those dynamics depend on very numerous physiological factors. Unluckily, the roles played by each of the factors are mixed, mingled, a bit like all the colors of the rainbow mingle in a white light. In order to separate the different colors contained in the white light, it has to be diffracted through an optical prism.
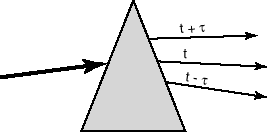
Similarly, if we may say so, thanks to Takens' theorem, the nonlinear dynamic analysis diffracts the effect of the various factors by scanning the signal through a temporal prism (fig. 2).
|
FIG. 2 - Comparison of Takens' theorem to a temporal prism. The effect of the various factors is diffracted, on an instant stretching from t - kt to t + kt . (k=1 on the figure) |
 |
To each of the n factors that determine the position of the center of pressure, we attribute (without naming them):
· A referential axis in a mathematical space with n dimensions,
· A value of the series of coordinates on that axis, X[t+kt ], determined by certain temporal shift, kt , relatively to reference instant t.
Those n coordinates give the position of the image-point of the system at "instant t", in that mathematical space with n dimensions, called "space of the phases".
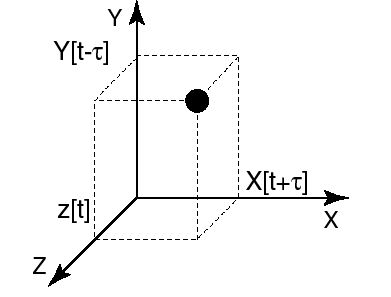 |
FIG. 3 - Building of an image of the dynamics of the system in the "space of the phases". To each factor we attribute a referential axis and the series of coordinates on that axis is determined by the temporal delay attributed to that factor. Here +t for factor X, -t for factor Y, 0 for factor Z. |
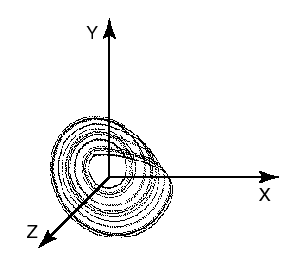
The trajectory of the image-point in the phases space (fig. 4) allows us to follow the evolution of the various factors through time.
|
|
 |
What for?
That image of the dynamics of the system in the space of the phases can be exploited in various ways.
As the different factors intervening in the dynamics of the system are distinguished, but unnamed, in the space of the phases, it would indeed be possible but totally useless to follow the evolution of each factor because, first we would not know what it is (each factor being unnamed), and then that evolution would be nothing else but the stabilometric signal itself! The series of the X[t+kt ] is identical to the series of the X [t], if we except a few extremes.
However it is possible to "count" those factors (Grassberger & Procaccia, 1983; Sugihara & May, 1990) to answer an important question: how many degrees of freedom does the system have? The more the factors intervening in the dynamics of a system, the more its degrees of freedom.
It is also possible to compare the images of two different systems in order to evaluate their correlation and their hierarchy (Le Van Quyen et al., 1999). If we can predict the image of a system B from the image of a system A, system A is of a higher "hierarchical level" than B, it "knows" more on B than B "knows" on it.
An application of the nonlinear dynamic analysis:
The nonlinear dynamic analysis proved clearly more performant than the conventional, frequential and stochastic analyses during a study of the adaptation of the fine postural control system to the wearing of prismatic glasses (Gagey et al., 1998).
The conventional analyses only showed a very slight reaction of the fine postural control system and only during the first minutes of adaptation to the wearing of prismed corrective glasses (fig. 5).
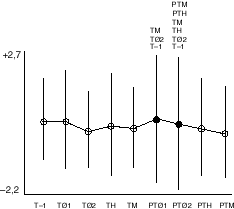 |
FIG. 5 - Postural adaptation to the wearing of corrective glasses. Means and standard deviations of parameter VFY before (T-1) and during the adaptation to the wearing of corrective glasses. The only statistically significant difference bears on variance: At the third minute (PTÆ 1) and at the sixth minute (PTÆ 2) of the wearing of prismed glasses, the variance of the distribution is significantly different. But that difference has completely disappeared after three hours (PTH) and after three weeks (PTM) of the wearing of prismed glasses. N=34, open eyes situation (From Gagey et al., 1998). |
On the contrary, one month after the beginning of the phase of adaptation to the prismed glasses, the nonlinear dynamic analysis still revealed a reduction of the degrees of freedom of the system (fig. 6).
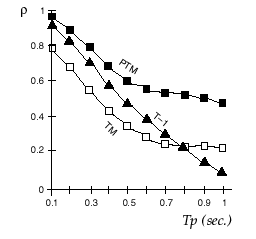 |
FIG. 6 - Postural adaptation to the wearing of corrective glasses. Coefficients of correlation, r , between the predicted and real images of the system, according to the interval of prediction, Tp (Sugihara-May's algorithm). Before the experiment (T-1), after one month of wearing of the prismed (PTM) and nonprismed (TM) glasses. The results of the intermediary times (TÆ , etc.) have been withdrawn from the graph for more clarity. We observe a reduction of the degrees of freedom of the fine postural control system that continues one month after the beginning of the adaptation to the prismed glasses. Subject in an open eyes situation (From Gagey et al., 1998). |
Conclusion
The nonlinear dynamic analysis still belongs to the field of clinical research:
· We cannnot tell how it will be used, or if it will be used at all!...
· It requires a specific type of platform that can sample the signal correctly at 40 Hertz...
But the time for that research has already begun, and we have to take full advantage of it.
Bibliography
Gagey P.M., Martinerie J., Pezard L., Benaim Ch. (1998) L'équilibre statique est contrôlé par un système dynamique non-linéaire. Ann. Oto-Laryngol., 115: 161-168.
Grassberger P., Procaccia I. (1983) Phys. Rev. Lett., 50, 346-369.
Le Van Quyen M., Martinerie J., Adam C., Varela F.J. (1999) Nonlinear analyses of interictal EEG map the brain interdependences in human focal epilepsy. Physica D, 127: 250-266.
Sasaki O., Gagey P.M., Ouaknine M., Martinerie J., Le Van Quyen M., Toupet M., L'Héritier A. Nonlinear Analysis of orthostatic posture in vestibulopathy (article soumis)
Sugihara G., May R.M. (1990) Nonlinear forecasting as a way of distinguishing choas from measurement error in time series. Nature, 344: 734-741.
Vierordt Karl von (1860/ 1862/ 1864/ 1871/ 1877) Grundiss der Physiologie des Menschen. H. Laupp, Tuebingen.