|
FIG. 1 - Weighted standard deviation of the displacement speed of the centre of pressure as a function of the Y-mean position. Eyes open situation. Pearson's correlation coefficient r = -0.92. N: 100. |
|
(14 décembre 1999; updated on 22nd march 2013)
During a systematic study of the correlations between all possible stabilometric parameters, we discovered by chance an extremely strong correlation between the Y-mean position and the weighted standard deviation of the displacement speed of the centre of pressure (Gagey & Gentaz, 1986) (fig. 1).
|
FIG. 1 - Weighted standard deviation of the displacement speed of the centre of pressure as a function of the Y-mean position. Eyes open situation. Pearson's correlation coefficient r = -0.92. N: 100. |
|
We then decided to study that surprising correlation in clinical stabilometry, simply by checking, thanks to the VFY parameter (Gagey & Gentaz, 1993), whether or not the subject is within the normal subjects' cloud of points (fig. 1).
A) Stiffness-mass Hypothesis
 |
The search for the meaning of that parameter very quickly guided us towards a phenomenon of stiffness of the inverted human pendulum, expressed through to the following analogy: the tighter the shrouds of a mast, the less it swings. The stiffer are the tissues of the posterior lodges of the legs that control movement of the inverted pendulum around the ankles, the less the muscles of the posterior lodges of the legs are solicited.
FIG. 2 - Study of the torques in the young subject. |
B) Experimental coherence
Two posterior experiments have been coherent with that hypothesis: an alteration of the stiffness of those posterior muscles of the legs, by a physical process (tactics of the hip) or a pharmacodynamic one (myorelaxing medicine), changes the values of parameter VFY in a statistically very significant way.
1) Tactics of the hip
|
The elderly use the tactics of the hip to stabilise (Horak et al., 1989). The study of the decomposition of the forces of the posture of aged people (Fig. 3) shows that may appear a force directed backwards that tends to have people fall backwards (which is well known in clinic). the stiffness of the tissue of the legs posterior lodges is very low, so the muscle contractions of these lodges are very important. And among elderly subjects, indeed, there is actually a progressive increase of the VFY parameter with age (Gagey et al., 1992) indicating a gradual reduction in tissue tension of the legs posterior lodges (Fig. 4).
FIG. 3 - Study of the torques in the old subject. |
|
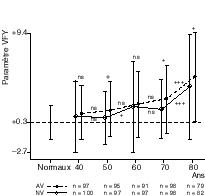 |
FIG. 4 - Evolution of parameter VFY with age. Means and standard deviations of parameter VFY in ten groups of various ages and vestibular states. The numbers of the groups in each decade are indicated at the bottom of the figure, with a distinction between the subjects affected (AV) or not (NV) by vestibular lesions. The mean and the standard deviation of parameter VFY in the normal young subject are shown for comparison. (From Gagey, Toupet, Heuschen, 1992). |
2) Myorelaxing medicine
The well known relaxing activity of the benzodiazepines induce an increase of the parameter VFY.
That is exactly what has been observed
in a group of 21 young subjects (mean age 22 years old) recorded
in an open eyes situation, three hours after having taken a 2.5
mg dose of lorazepam (fig. 5).
|
FIG. 5 - Histogram of the VFY under the influence of the lorazepam. Gaussian curve: theoretical normal distribution of parameter VFY in an open eyes situation. Histogram: distribution of the same parameter in a group of 21 subjects recorded in the same conditions three hours after having taken a 2.5 mg dose of lorazepam (p<0.001). |
|
C) Numerous errors on the VFY
The promising «career» of that parameter has been interrupted by a series of errors.
1) The Variance error
The parameter is calculated from the standard deviation of speed but for reasons of euphony, of concision, I have spoken of the «Variance» of speed. That is the first error, which did not help communication.
2) The programmation error
The time interval
between two successive samplings being always identical, in order
to calculate the displacement speed of the centre of pressure
between two successive samplings, one just has to calculate the
distance between the two successive positions of the centre of
pressure.
That calculation uses Pythagoras'
theorem: in a rectangle triangle the square of the hypotenuse
is equal to the sum of the squares of the sides of the right angle
(fig. 6).
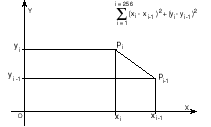 |
FIG. 6 - Calculation of the distance between two successive positions, p[i-1] and p[i], of the centre of pressure. The calculation applies Pytagoras' theorem. It is repeated for the 255 intervals between the 256 measured positions of the centre of pressure. |
The length of
the sides of the right angle is obtained by making the difference
between the successive coordinates, in x and in y. But the formula
on figure 6 contains an error on index i: it implies 257 is
whereas there are only 256 points. When i = 1, then i-1 = Ø.
Yet in the program, XØ and YØ were the coordinates
of the origin of the referential. The first calculated interval
is therefore the distance of the origin to the first position
of the centre of pressure. That distance is important relatively
to the distances between the successive positions of the centre
of pressure, and it consequently modifies considerably the value
of the variance and of the standard deviation of speed.
The standard deviation of speed
used for the calculation of the normalised VFY is therefore «weighted»
by the speed needed to cover the distance between the centre of
the support basis and the first sampled position of the centre
of pressure, during the time of a sampling interval.
3) The programmers' error
Some programmers,
noticing that error, rectified it and used a standard deviation
of speed without «weighting» it - they were forgetting
that the norms of parameter VFY were based on experimental data,
realized with the value of the weighted standard deviation of
speed. The parameter given by their program did not have anything
more to do with Normes85, to the great displeasure of platform
users, who were completely lost.
Other programmers, aware of the
importance of the algorithms used during the normalisation, rectified
the error within their own algorithms so that they revealed the
distance between the origin of the referential and the first position
of the centre of pressure. But they forgot that this distance
had to be divided by the duration of the sampling interval in
order to obtain a speed!... The VFY parameter they obtained was
therefore completely false.
4) The platform builders' error
From 1995, the
posturologists' group began to discuss the idea that the 5 Hz
sampling cadence was too slow. Some platform builders then proposed
machines that could sample the signal at superior cadences, without
calling their clients' attention enough on the fact that the Normes85
were based on recordings at 5 Hz. More, some stabilometry
programs were presented so as to make the 10 Hz cadence appear
like the usual acquisition cadence. Now, the length of the intervals
between two successive positions of the centre of pressure changes
considerably when the sampling cadence doubles!... and the relation
between sampling cadence and length is not linear (See «Should
we increase the sampling cadence in
stabilometry? » by P.M.
GAGEY, B. BAUDIN, G. BIZZO, A. SCHEIBEL & B. WEBER).
So a certain number of platforms
have been launched on the market whereas their VFY parameter did
not have any sense. The idea consequently spread among the posturologists'
group that this parameter did not have any interest.
So many errors,
so many misunderstandings, so many communication mistakes have
interfered in the history of the VFY that we can legitimately
ask the following question: should we save that parameter?
Our answer is a straightforward: Yes, we should save the VFY -
or at least its spirit - because the mass-Stiffness-Friction system
of the tactics of the ankle explains 90% of the phenomena observed
in stabilometry (Winter et al., 1998) and parameter VFY
only - or its substitute - evaluates the functionning of that
system.
A) The Mass-Stiffness-Friction system
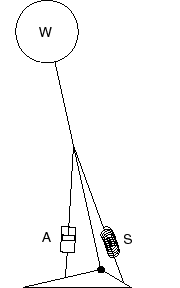 |
A pendulum
of mass W whose sway is controlled by the stiffness S of a spring
and the friction A of a shock absorber (figure 7) makes a mechanical
system of the second order we can call «tuned mechanical
circuit» by analogy with the tuned electronic circuits.
FIG. 7 - The tuned mechanical circuit |
In the tactics of the ankle, the muscles work as a shock absorber thanks to their viscosity, and as a spring thanks to their «elasticity», according to the physiologists' terminology, or their «stiffness», according to the physicians' terminology. Postural sway is therefore partially but really controlled by a tuned mechanical circuit.
B) The action of the torques
| FIG. 8 - Control of
the inverted pendulum by the play of the torques A: Position of balance aligned on the «mean position» - the forces acting on the pendulum, its wieght W, and the force of reaction coming from the base, R, are aligned, equal and of opposite direction. |
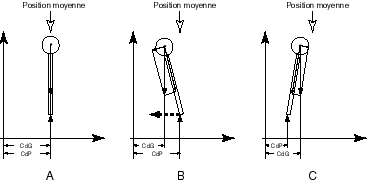 |
B: Position of imbalance. The centre of
gravity, CoG, deviates from the mean position whereas the centre
of pressure, CoP, sticks to it. The splitting up of the forces
reveals a nearly horizontal component, following the direction
of the movement of the CoG. That component creates a torque around
the CoP which tends to accelerate the movement of the CoG.
C: Position of control of the imbalance. The centre of pressure
has been moved beyond the vertical of gravity - in that new situation
the splitting up of the forces reveals an horizontal component
going opposite the direction of the movement of the CoG. That
component creates a torque around the CoP which tends to reverse
the movement of the CoG.
The control of the inverted pendulum by the action of the torques as it appears on figure 8 cannot be strictly applied to the tactics of the ankle because the centre of pressure and the centre of rotation of the human pendulum do not merge (fig. 9).
C) Calculating the action of the torques
We will use here the calculations of D A Winter.
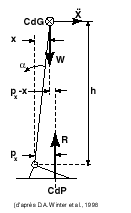 |
Let x
be the distance of the vertical of gravity to the tibio-tarsal
joint, the body weight, W, creates a torque, W.x, relatively
to the axis of that joint. In the stabilisation phase, the two forces, R and W, are not aligned anymore, the torques they create are not equal anymore and the difference between those two torques, R.px - W.x, is a force that provokes a rotation of the body mass around the ankle. As we know the moment of inertia, I, of the body around the axis of the ankles we can write the following equation: |
|
|
|
|
For small angles we can admit that:
 |
| Where | is the tangential acceleration of the body mass, |
h the height of the centre of gravity above the axis of the tibio-tarsals.
Equation 1 therefore becomes:
 (2) (2) |
As I, W and h are constants, we may deduce that the tangential acceleration of the centre of gravity of the inverted pendulum is proportional to the distance between the centre of pressure and the vertical of gravity.
D) Experimental study
Winter and his
collaborators have studied experimentally the pertinence of the
model of the inverted pendulum to express the postural control
of man standing at rest (Winter et al., 1998).
The evolution of the centre of pressure
was recorded by a stabilometry platform.
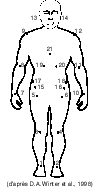 |
In order to measure the evolution of the centre of gravity, Winter and colleagues have recorded, by an optic process, the evolution of a series of 21 markers placed on the skin, from which it was possible to calculate at each moment the position of the centre of gravity, taking into account the quotient to the subject's mass of each marked part of the body (fig. 10). FIG. 10 - Position of the 21 markers used
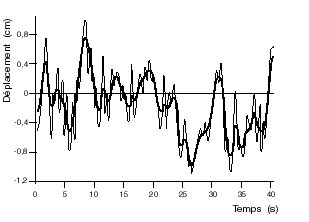
to follow the evolution of the position of the centre of gravity. The superposition of the curves of the evolution of the centre of gravity and of the centre of pressure (fig. 11) shows that the centre of pressure evolves on both sides of the centre of gravity, as already shown by Schieppati et Col. (1994).. |
|
FIG. 11 - Compared displacements of the centre of gravity and of the centre of pressure during a 40 seconds recording.
Thin line: displacements of the centre of pressure.
|
 |
From these experimental data, it is possible to calculate the evolution of signal px - x as well as that of the signal of tangential acceleration of the body mass.
If the
subject under experiment follows equation (2) of the model of
the inverted pendulum we must find a correlation
between the two experimental signals.
The Waterloo team indeed found a
coefficient of correlation of around - 0.91 for the sagittal sway
(Winter et al., 1997).
The mass-Stiffness-Friction model
of the inverted pendulum therefore corresponds to an important
part of the stabilisation phenomena. Clinicians cannot possibly
ignore its anomalies, but how should we measure them?
Parameter VFY
exists, and even if its history is chaotic, its significance is
more and more certain. A first solution would consist in keeping
using it, after having revised its method of calculation and having
made sure that the information has been transmitted correctly.
But anyway, the VFY would remain a «doctor's bad parameter»,
without any dimensional equation or correspondance to a physical
measure.
Now, the works of various teams
(Winter et al., 1998; Chow & Collins, 1995; Lauk et
al., 1998, 1999; Kuczynski, 1999) seem to have the capacity
to give us the mean to study the parameters corresponding to physical
realities. Such possibilities must not be neglected.
A) Choice of the best algorithm for the calculation of the VFY
If the correlation
between the mean position in Y and the weighted standard deviation
of the shifting speed of the centre of pressure is very high (Gagey
& Gentaz, 1986), the coefficient of correlation between that
same mean position in Y and the standard deviation of the displacement
speed of the centre of pressure is, on the contrary, very low
(Dimidjian, personal communication). We observe an important range
of variation of the coefficient of correlation. Now, these variations
have to be carefully studied during the definition of a normality
criterium because the normal subjects' dispersion relatively to
that criterium has to be as small as possible. In other words,
the normal subjects' cloud of representative points has to be
as tight as possible around the regression curve (fig. 12).
In search for the best possible
correlation between one expression of the variance of speed
and one position of the centre of pressure relatively to
the front-back axis, various different combinations have been
studied between Y mean, minimum Y, the standard deviation of speed
and the weighted standard deviation of speed in three different
groups respectively composed of 37, 89 and 162 normal subjects
(tables 1 & 2).
| Y-mean | Y-minimum | N | |
| Cohort RP | -0.06 | -0.13 | 162 |
| Cohort N85 | 0.03 | -0.34 | 89 |
| Cohort N98 | -0.20 | -0.44 | 37 |
TABLE 1 - Pearson's coefficient of correlation between the standard deviation of speed and Y mean or minimum Y, in three different groups.
| Y-mean | Y-minimum | N | |
| Cohort RP | -0,70 | -0,69 | 162 |
| Cohort N85 | -0,59 | -0,79 | 89 |
| Cohort N98 | -0,84 | -0,91 | 37 |
TABLE 2 - Pearson's coefficient of correlation between the weighted standard deviation of speed and Y mean or minimum Y, in three different groups.
Those various values of Pearson's coefficient of correlation correspond to normal subjects' clouds of representative points that are tighter and tighter around the regression curve (fig. 12).
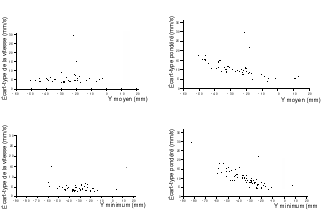 |
FIG. 12 - Evolution of the cloud of points
representing the normal subjects' distribution according to the
chosen algorithm.
The four algorithms described by the legends of the referentials
have been applied to the same group of normal subjects, N85. (N=89)
The best algorithm to define parameter VFY would therefore be, according to that study, the regression between the weighted standard deviation of speed and minimum Y.
B) Calculating the physical constants of stiffness and friction
Given a tuned mechanical circuit (fig. 13), if it is in a position of balance, the return torque exerted by the stiffness of the spring, S.a, is equal to the torque exerted by the weight of the pendulum W.h.a. If those two torques are not equal anymore, their difference creates a force that tends to make the pendulum pivot:
|
FIG. 13 - mass, stiffness, friction Where I: moment of inertia. By comparison with equation 2, we therefore have: |
|
Consequently:
The stiffness
of the spring is proportional to the position of the centre of
pressure relatively to that of the centre of gravity.
Calculating Fourier's transformed
of the signal CoP-CoG (fig. 14), Winter observed that the range
of that signal reaches a maximum at around 0.8 Hz, which is coherent
with the «One Hertz phenomenon» (Gagey et al.,
1985) and with the results of the diffusion analysis of the stabilometric
signal (Collins & De Luca, 1993).
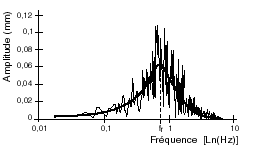 |
FIG. 14 - Fourier's transformed of
the signal of difference between the positions of the centre
of gravity and of the centre of pressure. The maximum of the amplitude corresponds to the own unabsorbed pulse, wØ, of a pendulum of the second order (mass, stiffness, friction), of which we know the relation with stiffness and the moment of inertia: |
Consequently:
Besides, we know that:
Where:
- Z is the coefficient of absorption,
- A the friction
- S the Stiffness,
- M the Mass,
- u the reduced pulse w/w n
- Q the quotient of absorption
C) The model of the «pinned polymer»
Chow and Collins
(1995) proposed a model of the postural control of the standing
at rest position, that is based on an analysis of statistical
mechanics: the model of the «pinned polymer». That
model was used by Lauk and colleagues (1998, 1999) to evaluate
the muscular stiffness of parkinsonians.
Maybe we are wrong, but we are not
a priori very favorable to that last method, for two reasons.
First, the analyses of statistical mechanics are opposed to what
we consider as a fact: the nonlinear dynamic nature of postural
control. And then, they come to a confusion between the fine postural
control system and the general postural control system. But maybe
the Boston school is right.
We thank Professor D.A. WINTER and Mr. Guy BIZZO for their precious help during the writing of that article.
References